

The alarm goes off. The body feels like concrete. Eight full hours passed, and still, completely wiped.
Most people shrug it off as stress or a bad mattress. But sometimes the answer is sitting in an abnormal sleep cycle graph, a simple chart that shows exactly what the brain does after the lights go out. Stage by stage, all night long.
Sleep is not just about hours. Deep sleep repairs the body. REM handles memory and mood. Light sleep bridges the gaps. Cut any of them short, and the whole night falls apart quietly, without a single wakeup the person would remember.
What it looks like, why it happens, and when those tired mornings deserve more than just another coffee.
Understanding the Sleep Cycle and Why It Matters
Most people treat sleep as a simple on/off switch. You close your eyes, wake up eight hours later, and that’s it. But sleep architecture, the precise pattern of brain activity, muscle paralysis, and biological repair across the night, is far more structured than that.
Every night, your brain and body move through a fixed sequence of stages, each one doing a specific job. Some stages repair your muscles and immune system.
Others process your memories and regulate your emotions. Miss any of these, even partially, and you feel it the next day through fatigue, poor focus, or low mood.
The problem is, most people have no idea their sleep is disrupted until the damage is already showing up in their daily life.
Before you can identify what an abnormal sleep cycle looks like, you first need to understand what a normal one looks like, stage by stage, cycle by cycle.
What a Healthy Sleep Graph Actually Looks Like
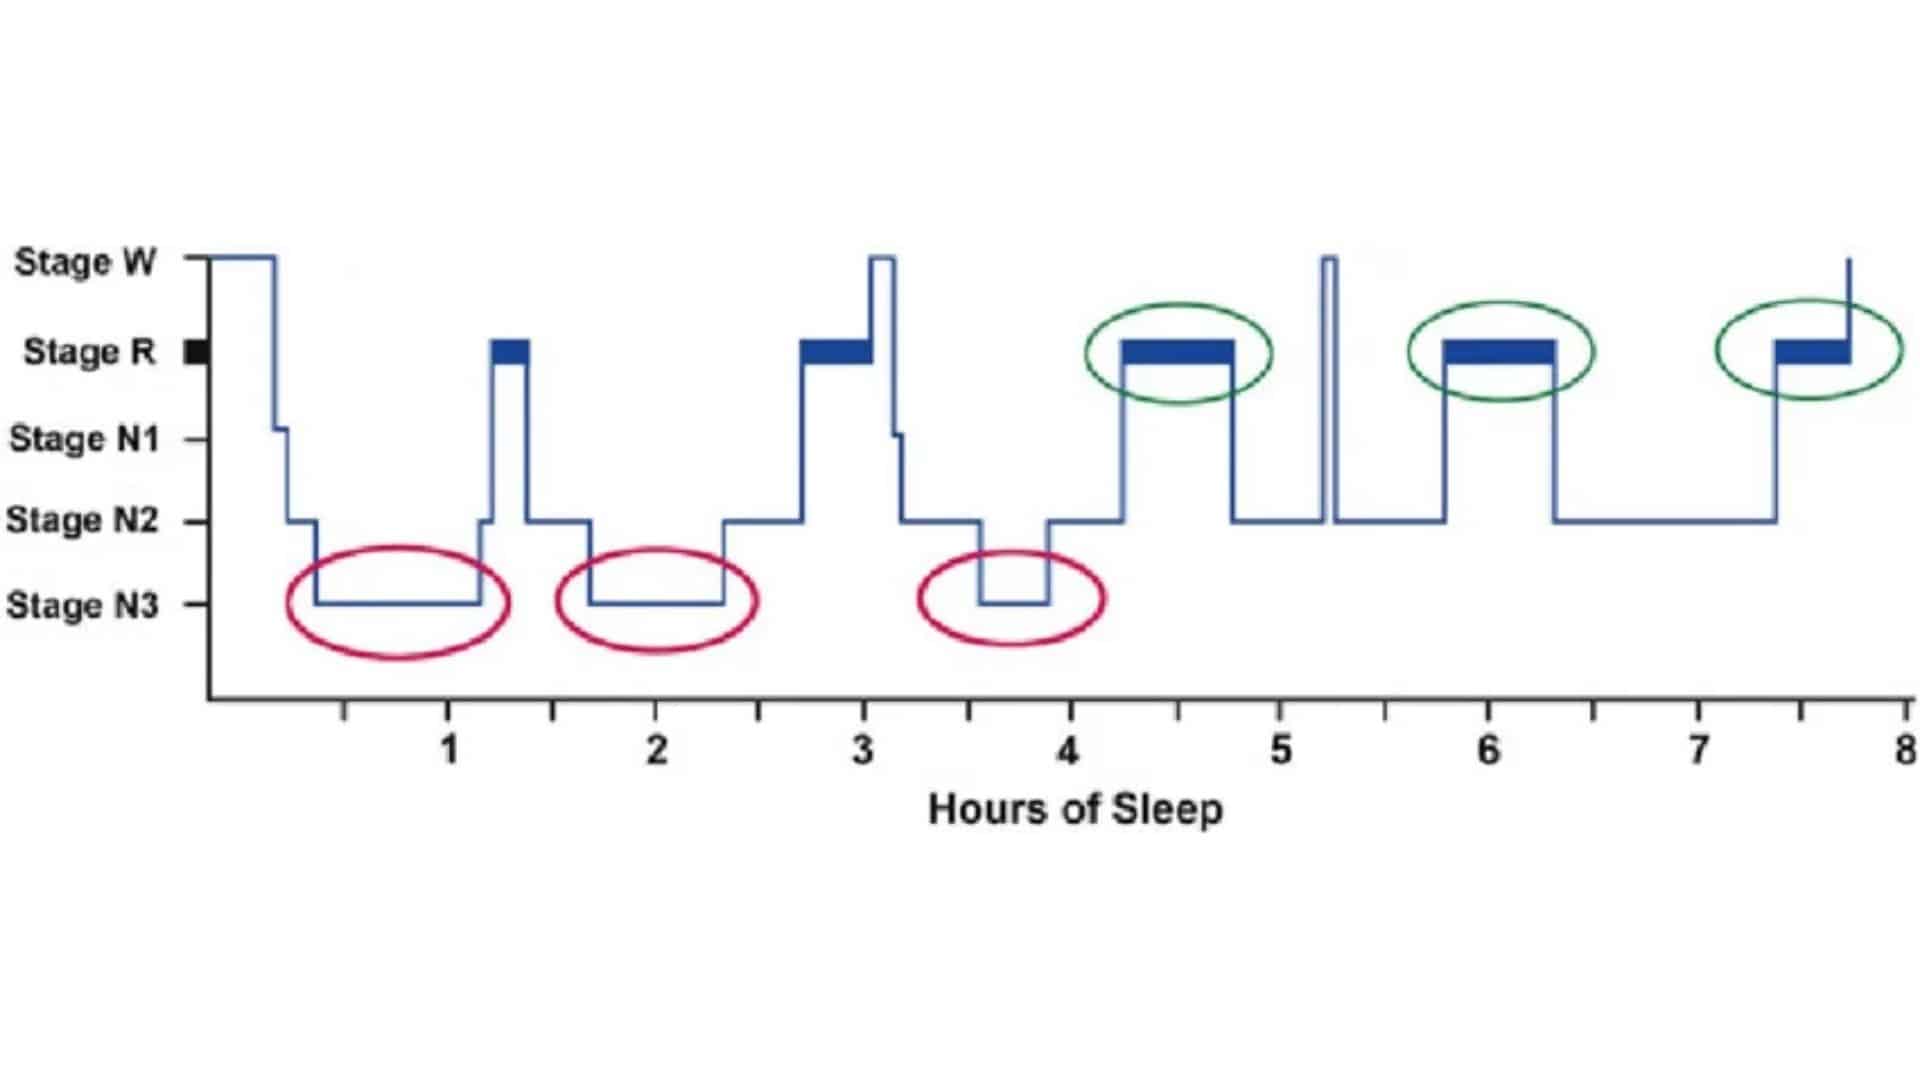
The graph above depicts the typical progression of sleep stages throughout the night. It shows the fluctuations between different stages of sleep over the span of about 8 hours. The sleep cycle is broken down into several stages, including:
- Stage W (Wake): This is the time when you are awake and alert. The graph shows that we experience moments of wakefulness throughout the night.
- Stage R (Rapid Eye Movement or REM): This stage, highlighted in black, is when the most vivid, narrative dreaming occurs. It typically recurs throughout the night. Note that some dreaming also occurs in lighter NREM stages, though it is typically less vivid and less memorable.
- Stage N1 (Light Sleep): The first stage of non-REM sleep, which occurs at the beginning of the cycle, marks the transition into deeper rest.
- Stage N2 (Deeper Sleep): Marked as a period of restful sleep, Stage N2 helps with memory consolidation.
- Stage N3 (Deep Sleep): The deepest stage of sleep, crucial for physical restoration and immune function. The red circles in the graph highlight the periods of deep sleep, which are vital for health and recovery.
The green circles show the REM sleep periods that recur multiple times throughout the night.
Notice how these cycles tend to repeat in a pattern, each lasting approximately 90 minutes. This visual layout illustrates the natural flow of the sleep cycle and how the stages interconnect for optimal rest.
Healthy sleep stage breakdown (approximate, adults 18–65): N1 makes up around 5% of total sleep, N2 around 50%, N3 (deep sleep) around 20–25%, and REM around 20–25%. If your wearable consistently shows deep sleep below 10% or REM below 15%, that warrants attention.
What Is a Hypnogram?
A hypnogram is simply a graph of your sleep. It plots every stage of sleep you pass through across the night on a single line, from the moment you fall asleep to the moment you wake up.
Doctors and sleep specialists use it to see, at a glance, whether your sleep architecture is healthy or broken. Think of it as an ECG for your sleep.
Just like a heart ECG shows peaks and dips of your heartbeat, a hypnogram shows peaks and dips of your sleep depth throughout the night. You do not need to be a doctor to read one.
Once you know what each line and level means, the graph tells a very clear story.
How Sleep Disorders Disrupt Your Sleep Graph
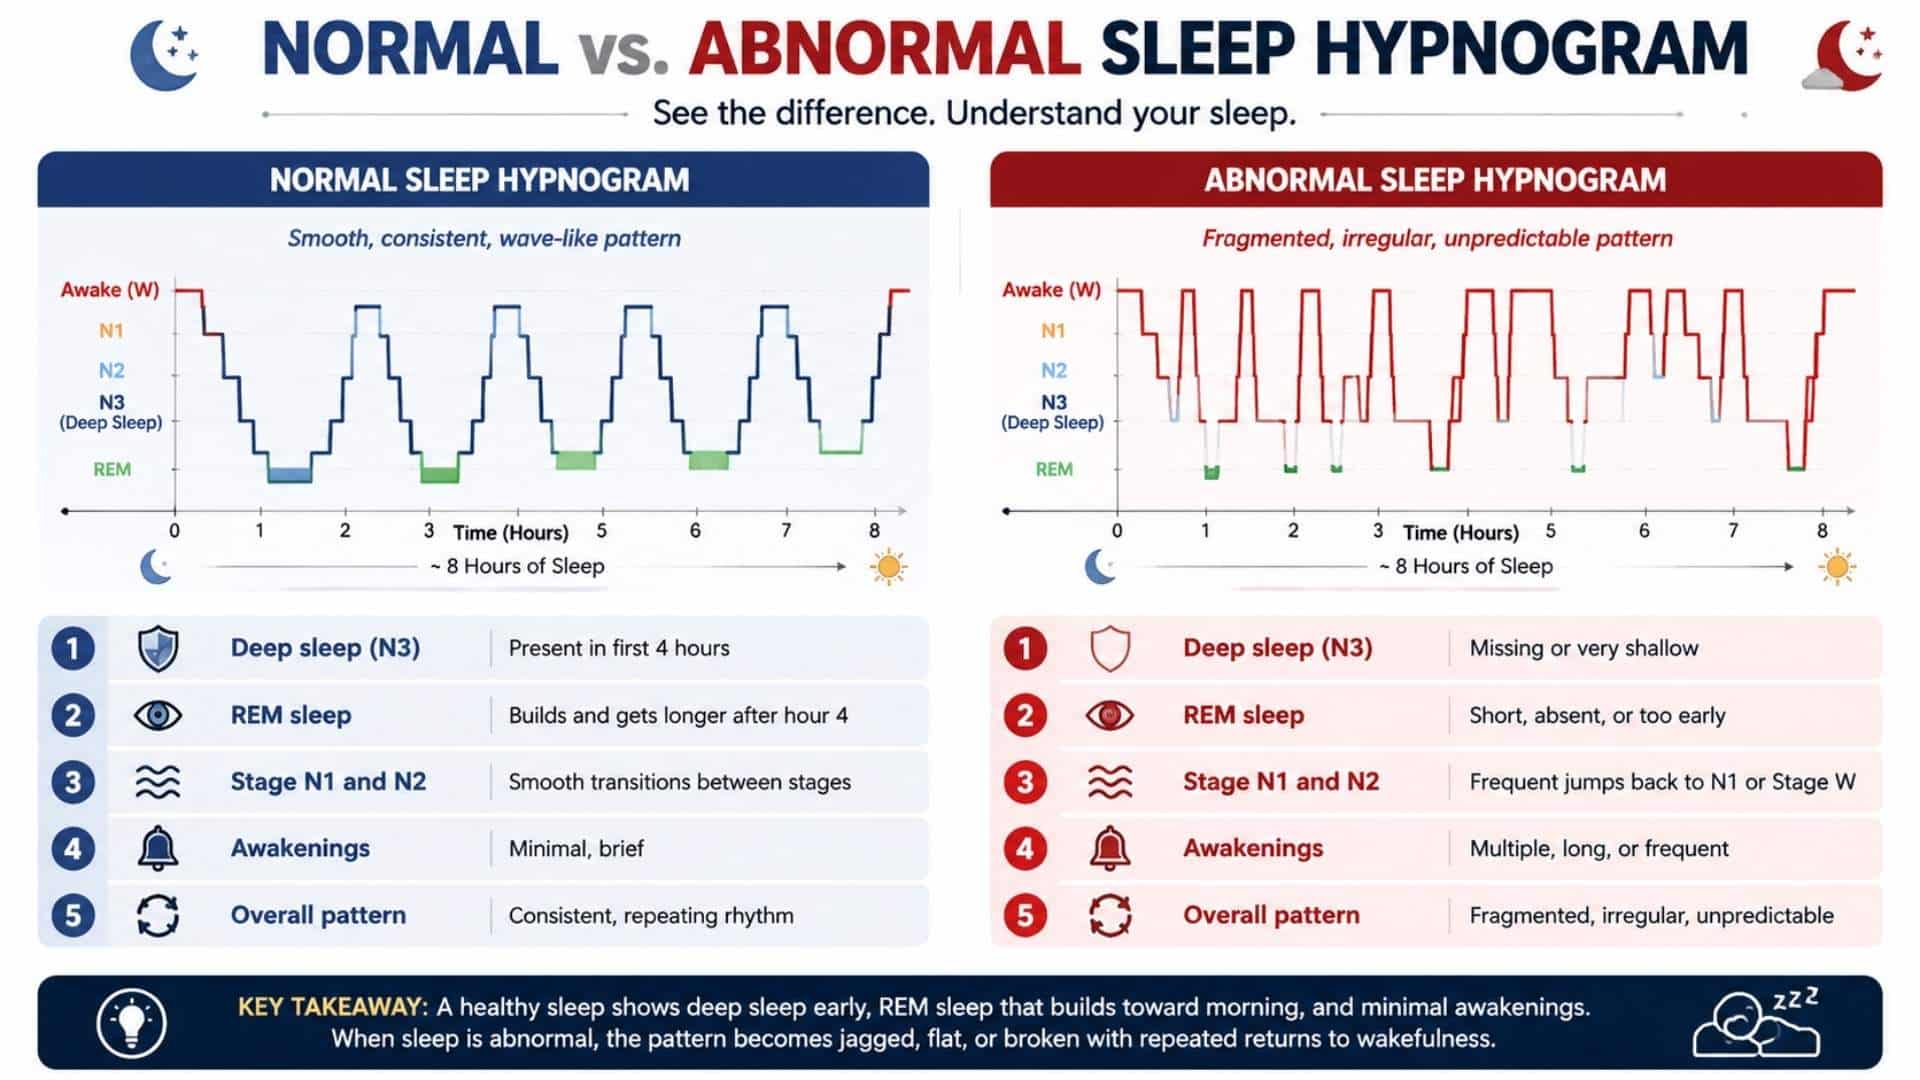
A healthy sleep graph shows a smooth, predictable wave pattern, but sleep disorders disrupt this rhythm in specific ways. Each disorder leaves its own unique mark on the graph.
1. Sleep Apnea: Interrupted Breathing and Repeated Awakenings
Sleep apnea is a disorder where breathing stops and starts throughout the night, causing multiple brief awakenings. These awakenings are usually so brief that the person doesn’t remember them, but they disrupt the sleep cycle, preventing the body from reaching restorative deep and REM sleep. This leads to daytime fatigue and other health issues, such as headaches and difficulty concentrating.
How it looks in a hypnogram: The graph shows repeated spikes back to Stage W, with minimal deep sleep and fragmented REM.
2. Insomnia: Difficulty Falling and Staying Asleep
Insomnia isn’t just about struggling to fall asleep; it involves waking up multiple times during the night or too early in the morning.
Insomniacs often feel unrested, even after a full night’s sleep, because their body never reaches deep, restorative sleep stages. The fragmented nature of their sleep cycle prevents full recovery, leading to daytime tiredness and irritability.
How it looks in a hypnogram: The graph shows delayed sleep onset, shallow or absent deep sleep, and multiple returns to Stage W throughout the night.
3. Narcolepsy: Sudden Jumps Into REM Sleep
Narcolepsy is characterized by an inability to regulate sleep cycles, leading to sudden transitions from wakefulness to REM sleep. This condition can cause excessive daytime sleepiness, sleep attacks, and vivid dreams.
It often disrupts normal functioning by causing the brain to skip the usual sleep stages, leading to an abnormal sleep pattern that includes REM sleep at the wrong times.
How it looks in a hypnogram: The graph shows a rapid onset of REM sleep, skipping N2 and N3, with disorganized deep sleep.
4. REM Sleep Behavior Disorder: Disrupted REM Sleep
In REM Sleep Behavior Disorder (RBD), the body fails to remain paralyzed during REM sleep, leading to physical movements such as talking, kicking, or even violent actions during dreams.
This disruption not only affects sleep quality but may also signal underlying neurodegenerative conditions, such as Parkinson’s disease. People with RBD often wake up feeling unsettled and confused from these movements.
How it looks in a hypnogram: The graph shows broken and interrupted REM blocks, with frequent arousals and jumps from Stage R.
How Substances Affect Sleep StagesAlcohol, caffeine, and some medications can change your sleep graph. Alcohol may help you fall asleep faster, but it often disrupts REM later in the night. Caffeine can delay sleep and reduce deep sleep, even when you still fall asleep. SSRIs may suppress REM, while benzodiazepines can reduce deep sleep. If medication seems to affect your rest, speak with your doctor before making changes. |
Breathing Rate While Sleeping
Breathing rate is a key indicator of how well your body rests during sleep. Consistently abnormal breathing rates can signal health issues that need attention.
Normally, your breathing rate slows as you fall asleep and becomes more rhythmic, with the slowest and most regular breathing occurring during deep sleep (N3).
During REM sleep, breathing becomes more irregular and variable; this is a normal feature of REM, driven by the same dream-related brain activity that produces vivid imagery. Abnormal rates of breathing are classified into two types:
Tachypnea (Fast Breathing):
- Consistently above 20 breaths per minute during NREM sleep stages. During REM sleep, some variability and brief increases above 20 brpm are normal.
- Causes: Sleep apnea, fever, stress, heart/lung conditions, acid reflux.
- Symptoms: Shortness of breath, chest tightness, and morning fatigue.
Bradypnea (Slow Breathing):
- Consistently below 12 brpm outside of deep sleep.
- Causes: Central sleep apnea, sedatives, alcohol, hypothyroidism.
- Symptoms: Morning headaches, grogginess, chronic fatigue, and long pauses in breathing.
When abnormalities persist, consult a doctor, especially if accompanied by fatigue, headaches, or difficulty breathing.
![]()
Signs You Should See a Sleep Specialist
A GP is a good starting point, but sleep disorders need a specialist diagnosis. Here are five signs you should book a sleep specialist directly.
- Your partner notices you stop breathing during sleep: Repeated breathing pauses are the clearest sign of sleep apnea. Do not wait on this one.
- You wake up exhausted after a full night of sleep every day: If 7 to 9 hours of sleep never leaves you refreshed, your sleep architecture needs clinical investigation.
- You fall asleep suddenly and uncontrollably during the day: Falling asleep mid-conversation or while eating is a red flag for narcolepsy or an undiagnosed sleep disorder.
- You physically act out your dreams at night: Kicking, punching, or shouting during sleep suggests REM Sleep Behavior Disorder and needs proper medical evaluation.
- You have had poor sleep consistently for more than 3 months: Chronic insomnia lasting over 3 months is a clinical condition. Lifestyle changes alone are unlikely to resolve it.
Do not ignore these signs. Early diagnosis means faster, more effective treatment and significantly better sleep quality in the long run.
Can Wearables Track Your Hypnogram?
The short answer is: yes, partially, but not with clinical precision.
Wearables track sleep using actigraphy, which measures movement, heart rate, heart rate variability (HRV), skin temperature, and blood oxygen levels. The device then uses an algorithm to estimate which sleep stage you are in at any given time.
| Device | Tracks Sleep Stages | Tracks Breathing Rate | How It Works |
|---|---|---|---|
| Oura Ring | Yes (N1, N2, N3, REM) | Yes | HRV, skin temperature, movement |
| Fitbit (Sense/Versa) | Yes (Light, Deep, REM) | Yes | Heart rate, movement, SpO2 |
| Apple Watch | Yes (Core, Deep, REM) | Yes (via third-party apps) | Heart rate, accelerometer |
| Garmin (Fenix/Vivofit) | Yes | Yes | Heart rate, pulse oximetry |
| Whoop | Yes | Yes | HRV, heart rate, movement |
Wearables can show useful sleep trends, but they estimate sleep stages. Polysomnography (PSG) is the clinical test that directly records brain activity and provides a more accurate hypnogram.
What Wearables Cannot Do:
- Replace a clinical sleep study (polysomnography)
- Diagnose any sleep disorder
- Track brain activity directly (only a PSG with EEG electrodes can do this)
- Give 100% accurate stage-by-stage data
Think of wearables as a smoke detector. They are good at telling you something might be wrong. They are not the fire department.
Wrap Up
Most of us never think about sleep until something goes wrong. But your body has been leaving clues every single night, through your sleep graph, your breathing rate, and how you feel every morning.
Once you understand what a normal hypnogram looks like, the abnormal one becomes hard to ignore. Missing deep sleep, broken REM, irregular breathing. These are not random. They mean something.
You do not need a sleep lab to start paying attention. Track your patterns, make small changes, and take consistent warning signs seriously. Sleep is not a luxury. It is the foundation on which everything else runs.
If this helped you see your sleep differently, bookmark it for later and share it with someone who brushes off their tiredness as just part of life. It probably is not.
Frequently Asked Questions
Can Anxiety or Stress Change Your Hypnogram?
Yes. Anxiety reduces deep sleep, delays sleep onset, and causes frequent awakenings, making the graph look shallow and fragmented.
Is it Dangerous to Have an Irregular Breathing Rate While Sleeping?
Irregular breathing during REM is normal. But breathing pauses over 10 seconds or rates above 22 brpm need medical attention.
What is the Difference Between a Hypnogram and A Polysomnography?
Polysomnography is the full sleep test done in a lab. A hypnogram is just the sleep stage graph it produces.